What is MCP observability? MCP observability is the ability to monitor, inspect, and audit AI agent activity across MCP server connections: capturing tool invocations, policy decisions, sensitive data handling, latency, errors, and the identity context behind every agent action. It is what makes AI-connected tool access visible, governed, and explainable in production environments.
AI agents are no longer limited to chat windows and draft generation. With the Model Context Protocol, they can connect to external tools, query systems, retrieve documents, update records, and take action across business applications.
That changes the enterprise monitoring problem.
When an employee uses an AI assistant to summarize a document, the risk is mostly about the prompt and the model response. When that same assistant can access Slack, HubSpot, GitHub, Supabase, Snowflake, internal APIs, or production databases through MCP servers, the question becomes much broader:
Who used the agent? Which MCP server did it call? Which tool call ran? What data was accessed? What policy allowed it? What happened next?
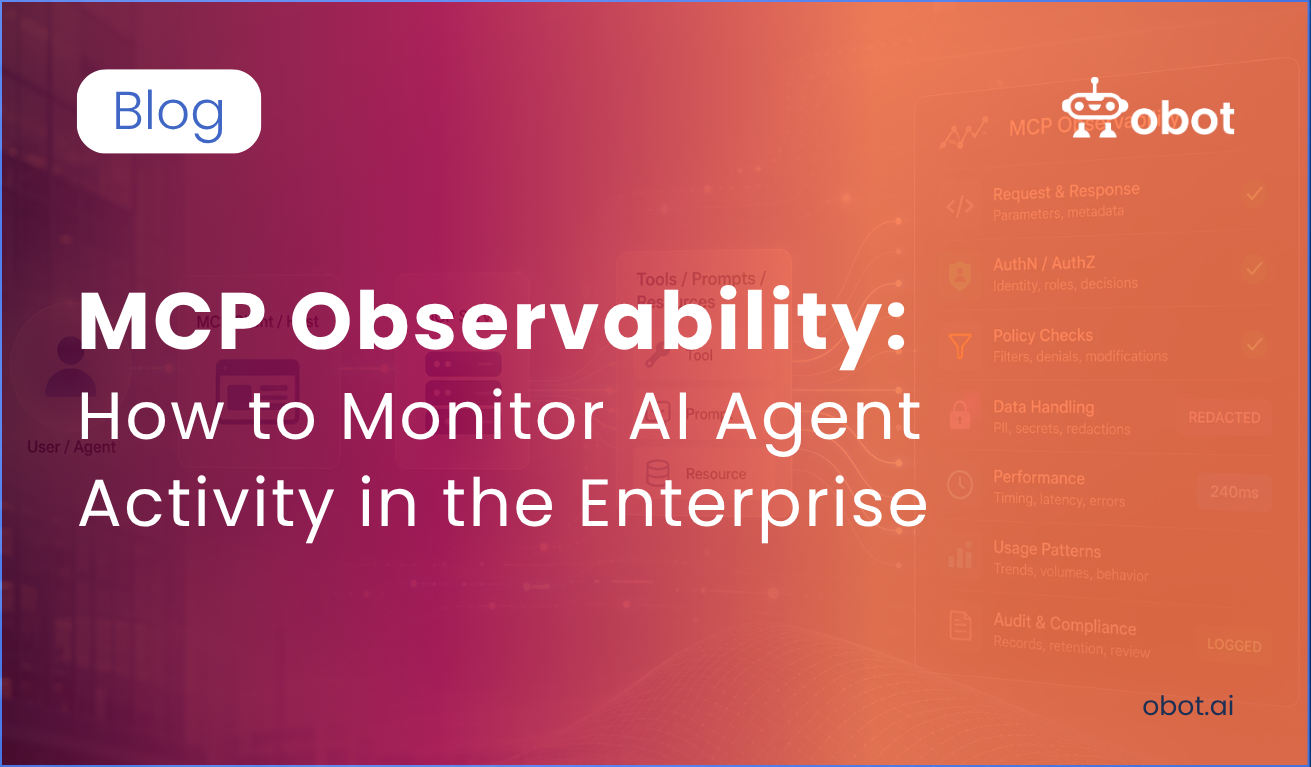
MCP observability is the ability to monitor, inspect, and audit AI agent activity across MCP server connections. In practice, that means capturing the full AI agent activity trail around agent-to-tool interactions:
The user or agent that initiated the request
The MCP client or host involved
The MCP server being accessed
The specific tool, prompt, or resource invoked
Request parameters and response metadata
Authentication and authorization decisions
Policy checks, filters, denials, or modifications
Sensitive data handling, including PII or secrets that were detected, blocked, redacted, or allowed
Timing, latency, errors, and usage patterns
Audit records for compliance and incident review
Traditional observability focuses on whether an application is healthy. MCP observability focuses on whether AI-connected tool access is visible, governed, and explainable. That distinction matters because MCP gives AI systems access to real business systems. The MCP tool specification defines how tool servers expose callable tools to models. Those tool invocations may read files, search records, create tickets, send messages, or trigger workflows. The observability layer has to account for those actions as security-relevant business events, not just backend requests.
Why Normal Application Monitoring Is Not Enough
Most organizations already have logs, traces, metrics, SIEM tools, and cloud monitoring. Those systems remain important, but they do not automatically answer MCP-specific questions.
An API log might show that a CRM endpoint was called. It may not show that the call was initiated by an AI agent acting on behalf of a particular user inside a particular conversation. An infrastructure trace might show latency through a service. It may not capture the tool name, the agent context, the policy decision, or the sensitive data boundary involved.
The structural gap is specific. Large language models connecting to external tools through MCP servers produce non-deterministic behavior: the same prompt can produce different tool selection decisions and different outcomes depending on what context was available. When something goes wrong in an agentic system, the system often produces no error messages at all. It produces a subtly wrong outcome that only surfaces when a user notices, days later, that the agent took the wrong action. The context needed to diagnose it was never captured.
Traditional application performance monitoring was built for deterministic services where the same input produces the same output and failures produce error codes. MCP server monitoring requires a different model: one that captures decision chains, identity context, and policy outcomes alongside the standard performance signals.
According to Datadog’s MCP security guidance, teams need visibility into MCP server interactions including authentication attempts, tool call registrations, invocations, parameters, responses, and error codes. Their recommendation is to treat MCP activity as a first-class source of operational and audit data. For enterprise teams, that means MCP observability has to sit closer to the MCP control point, not bolted onto general infrastructure monitoring after the fact.
The Enterprise Risks Without MCP Observability
Without MCP observability, AI adoption creates blind spots that compound over time. A team may install a local MCP server for a coding assistant. Another may connect an agent to a SaaS application. A third may expose an internal tool through a custom server. Each connection may be useful on its own, but together they create a distributed access layer with inconsistent logging, unclear ownership, and limited visibility.
An industry analysis of over 16,400 MCP implementations, published by Zeo Agency, found that 73% of MCP monitoring failures originate at the transport and protocol layer: the most commonly overlooked layer in mcp server monitoring setups, and the most consequential. According to a security analysis of 300+ production deployments, 80% of organizations report their AI agents have already performed actions beyond their intended scope: accessing unauthorized systems, sharing sensitive data, or revealing credentials. Most had no MCP observability infrastructure that would have surfaced the behavior while it was happening.
The risks are concrete:
Shadow MCP servers appear outside approved IT workflows
AI agents gain access to tools without centralized policy
Sensitive data flows into prompts or model contexts without review
Tool call permissions expand without administrators noticing
Security teams cannot reconstruct what happened during an incident
Compliance teams cannot prove who accessed what data and why
This is why MCP observability is not just a developer concern. It is an IT, security, compliance, and governance concern.
What Enterprises Should Monitor
A practical MCP observability model should capture activity at several levels. Skipping any one of them produces blind spots that compound the others.
1. Identity and Attribution
Every request should be attributable to a user, group, service account, or AI agent identity. Generic shared credentials make investigations harder and weaken policy enforcement. Without identity attribution, the question “who did this?” cannot be answered, which means neither security teams nor compliance teams can act on the audit logs the system produces.
2. MCP Server Inventory and Discovery
Before an enterprise can govern MCP usage, it needs to know what MCP servers are already configured. Teams need to know which MCP servers are installed, approved, active, and actually being used. A trusted catalog or registry becomes part of the MCP observability story because it defines the known universe of approved MCP capabilities.
Client-side discovery matters here specifically: MCP servers configured in local AI agent tools like Claude Desktop, Claude Code, Cursor, VS Code, Windsurf, and Codex may be operating entirely outside IT visibility. Device scanning that inventories MCP server configurations across developer machines is the first step in observability, before any tool call is ever logged.
3. Tool Call Monitoring
The most important event in MCP is often not the HTTP request itself, but the tool invocation: what tool call was made, with what parameters, against which connected system, and with what result. MCP tool call monitoring should capture the tool name, tool parameters passed, mcp responses returned, latency at both the MCP layer and the downstream API, and error codes or failures.
Latency spikes deserve specific attention. A tool that reliably runs in 80ms but occasionally spikes to 2,400ms produces AI agent behavior that looks erratic and unpredictable. Without tool invocation duration tracking at p95 and p99, the pattern is invisible. As Grafana Labs documents in their MCP observability guide, request throughput and downstream API latency must be tracked separately to determine which layer is responsible for degradation.
4. Policy Decision Logging
MCP observability should show whether a request was allowed, denied, filtered, modified, or routed through a specific control. This is the difference between passive MCP logging and governed access. A detailed log that records only successful tool calls misses the most important events: the requests that were blocked, modified, or triggered a policy alert.
5. Sensitive Data Handling
MCP servers can expose customer records, employee data, credentials, source code, or regulated information. Enterprise AI agent monitoring should show when sensitive data is detected, whether a guardrail blocked or redacted it, and whether the original request or response was allowed to proceed. For PII specifically, the relevant question is not only “did a tool call run?” but “what data crossed the boundary?”
This is especially important as MCP adoption expands into HR tools, CRM systems, financial data, and healthcare applications where regulated data is common.
6. Usage Patterns and Operational Signals
Which MCP servers are popular? Which tool calls fail often? Which teams are adopting MCP? Which connections are unused? These signals help IT teams manage both risk and operational value. AI agent performance monitoring at the usage pattern level also surfaces MCP adoption trends that may require policy review before they scale.
Teams with strong AI agent performance monitoring practices report 2.2x better reliability than those without, according to survey data from Galileo’s research. The difference is the feedback loop: teams that can see what their agents are doing can fix problems before they compound.
Why Per-Server Logging Does Not Produce Deep Observability
Instrumenting individual MCP servers solves the visibility problem within each server. It does not solve the attribution problem across servers.
An AI agent that calls four MCP servers in sequence to complete a workflow produces four separate logs. Without a shared identifier linking those logs to the same agent session, the team can see that each server was called. They cannot see the chain. They cannot answer: which agent initiated this sequence, under which user identity, and what was the cumulative effect across all four systems?
Shadow MCP compounds the problem. When an employee connects an unapproved MCP server directly to a local AI agent or coding tool, that server exists outside any per-server instrumentation the organization has deployed. Those tool calls produce no AI agent activity logs visible to IT. Only 18% of MCP deployments implement any form of access scoping for tool parameters and permissions, according to the State of MCP Server Security 2025 analysis. The remaining 82% are not just unprotected. They are unobservable by design.
The MCP gateway is the only architectural position that sees every tool call, from every MCP client, to every server, with the identity context that makes attribution possible. Per-server MCP logging produces fragments. A gateway produces a chain.
👉 Explore Obot MCP Gateway — open-source, self-hostable, MIT licensed. Full audit trail at the tool-call level, OpenTelemetry export to any SIEM. Try free or read the docs.
MCP Observability and the Rise of First-Party MCP Servers
The MCP ecosystem is moving quickly. AWS has published AWS MCP Servers for code assistants. Cloudflare has introduced tooling for remote MCP servers and MCP server portals. More SaaS vendors are adding first-party MCP support. That is good for MCP adoption, but it does not remove the need for enterprise control.
Not all MCP activity begins inside a governed gateway. Some of it starts on a developer laptop, in a coding agent configuration file, or in a local desktop client. For enterprise teams, that means MCP observability has to start with discovery: what clients are in use, what MCP servers are configured, and which connections are already operating outside approved workflows.
Obot MCP Gateway approaches this as a control-plane problem. The goal is not only to log tool calls after they happen. Enterprises also need to understand the MCP landscape, identify shadow usage, decide which MCP servers should be approved, and govern access through a central path.
Device scanning supports that first step. It helps teams inventory local AI agent client configurations across tools like Claude Code, Claude Desktop, Codex, Cursor, Goose, VS Code, Windsurf, and Zed. It can show which MCP servers, skills, and plugins are present on users’ machines, giving administrators a practical way to answer the first MCP observability question: what MCP servers are people actually running?
From there, Obot gives teams a governed path for approved MCP access. Users can discover approved MCP servers through a private catalog, while administrators define access policies and manage which servers are available. The Obot MCP gateway provides a controlled path between MCP clients and MCP servers, handling authentication, authorization, request and response metadata, audit logs, filtering, and token exchange. That gateway position is also where teams can apply guardrails around sensitive data: blocking or redacting PII before it flows further into an AI agent workflow.
Obot MCP Gateway is open-source (MIT licensed), self-hostable on Kubernetes or Docker, and available as a managed service. Same product either way. For organizations where sensitive AI agent activity logs cannot route through third-party infrastructure, the self-hosted deployment keeps all telemetry inside the VPC.
The goal of MCP observability is not to collect more logs for their own sake. The goal is accountability. When an AI agent touches business systems, an enterprise should be able to answer:
Who initiated the action?
What MCP server and tool were used?
What data or system was accessed?
Was the action allowed by policy?
What was returned to the agent?
Was anything blocked, filtered, or modified?
Was sensitive data detected, redacted, or prevented from leaving an approved boundary?
Can the event be reviewed later for security, compliance, or troubleshooting?
That is the standard enterprise teams should expect before deploying MCP broadly.
AI agents are becoming a new interface to company systems. MCP is becoming the protocol that connects those agents to tools and data. Observability is what makes that activity manageable. For enterprises, the path forward is not to block MCP adoption. It is to put MCP behind a control plane that makes agent activity visible, governed, and auditable from the start. Obot provides that layer for organizations that want to adopt MCP without losing control of how agents access their systems.
MCP observability is the ability to monitor, inspect, and audit AI agent activity across MCP server connections. It captures tool call identity, parameters, mcp responses, policy decisions, sensitive data handling, latency, and error rates across all agent-to-tool interactions. It differs from standard AI agent monitoring in that it is specifically designed to answer governance questions: who accessed what, what policy applied, and what data crossed what boundary.
Which observability tools have an MCP integration?
Several enterprise observability platforms have added MCP server monitoring support. Datadog LLM Observability provides end-to-end tracing for MCP clients, capturing session initialization, tool call invocations, and error codes. Grafana Cloud includes pre-built dashboards for MCP protocol health, tool usage analytics, and performance metrics via OpenLIT instrumentation. Elastic APM supports distributed tracing for MCP workflows through the OpenTelemetry SDK. Purpose-built MCP gateway platforms like Obot include native audit logs, AI agent activity dashboards, and OpenTelemetry export to any SIEM backend.
Why can’t I use existing APM tools for MCP monitoring?
Traditional APM tools capture whether a service is healthy and how long requests take. They do not capture the AI agent identity, the tool call context, the policy decision that allowed or blocked the request, or whether sensitive data crossed a boundary. An API log might show a CRM endpoint was called. It will not show that the call was initiated by an AI agent acting on behalf of a specific user inside a specific conversation. MCP server monitoring requires a layer that understands the MCP protocol, not just the HTTP transport beneath it.
What should enterprises monitor for MCP server observability?
At minimum: identity and attribution for every request, MCP server inventory and discovery including shadow servers, tool call logging with parameters and responses, policy decision records showing what was allowed or denied, sensitive data handling events, and usage patterns across teams and agents. The 73% of MCP failures that originate at the transport layer also require connection health monitoring: session initialization rates, handshake success, and protocol compliance errors.
How does MCP observability relate to EU AI Act compliance?
The EU AI Act’s Article 12 requires that high-risk AI systems enable automatic logging sufficient for post-hoc reconstruction of individual AI-assisted decisions, not just output storage but the complete decision chain. Full enforcement begins August 2, 2026. For organizations deploying AI agents in customer support, financial analysis, HR automation, or other high-risk use cases, MCP tool call activity is in scope. Per-server MCP logging produces fragmented records that cannot satisfy this requirement. A gateway that captures the complete attributed chain in one place is the architectural response.
What is the difference between MCP monitoring and MCP observability?
MCP monitoring tracks known failure modes: is the server up, is latency above threshold, is the error rate acceptable. MCP observability addresses unknown failure modes: why did the AI agent choose this tool call, what was the full sequence of actions in this session, and why did the agent’s output differ from what was expected. LLM observability covers the model inference side. MCP observability extends that into the tool access layer, capturing the full agent-to-tool-to-result chain with the context needed to debug, audit, and govern agentic AI workflows.
How does an MCP gateway enable enterprise observability?
An MCP gateway sits between all MCP clients and all MCP servers, making it the single point in the architecture that sees every tool call with complete context: calling identity, session, tool parameters, response, latency, and timestamp. It captures the cross-server chain that per-server instrumentation cannot produce. It detects shadow MCP connections by making itself the only permitted path to approved servers. And it exports structured telemetry via OpenTelemetry to any SIEM or observability backend the enterprise already uses, integrating AI agent activity logs into existing security and operations workflows.